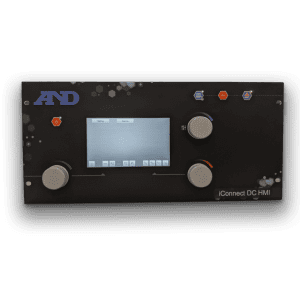

With the rise of companies like Apple, Intel, and Oracle, which pioneered groundbreaking advancements in computing and software, Silicon Valley was flourishing in the 1980s. Over the years, the valley’s ecosystem, fueled by venture capital, a spirit of entrepreneurship, and a collaborative culture, has consistently been at the forefront of the global tech revolution, continuing to shape the world with its transformative innovations. In 1984, A&D Technology’s predecessor company, DSP Technology, used high-speed data acquisition systems to collect test data for high profile projects.
Some of those projects involved testing crash barriers for Ford and GM, testing ozone hole layers, and nuclear reactor wall penetrability for the F-4 Phantom Rocket Sled.
Data Acquisition Systems
A high-speed data acquisition system is designed to rapidly sample and record data from various sensors or sources at extremely high rates. It is commonly used in applications where capturing fast-changing signals or events is critical. Here’s a general overview of how a high-speed data acquisition system works:
- Sensors and Signal Conditioning: The system begins by interfacing with the sensors that are capturing the data. These sensors can include accelerometers, strain gauges, thermocouples, pressure transducers, cameras, or any other transducers capable of detecting physical phenomena or signals. The signals from these sensors often need to be conditioned to ensure they are within the appropriate voltage range and noise-free before being processed further.
- Analog-to-Digital Conversion (ADC): Once the signals are conditioned, they are sent to the analog-to-digital converter (ADC). The ADC converts the continuous analog signals into discrete digital samples. The speed and resolution of the ADC are critical in high-speed data acquisition systems as they determine how accurately and quickly the continuous signals are converted into digital data.
- Buffering and Storage: The digital samples are stored temporarily in a buffer before being transferred to a storage medium. The buffer is essential in high-speed systems because the data is acquired much faster than it can be written to storage. The buffer allows for temporary storage and smooth transfer to the storage medium without losing data.
- Transfer and Storage Medium: The data is then transferred from the buffer to a storage medium, which could be a hard drive, solid-state drive (SSD), or high-speed memory module. The choice of storage medium depends on the data acquisition rate and the amount of data that needs to be stored.
- Timestamping and Synchronization: High-speed data acquisition systems often require precise timestamping and synchronization to ensure accurate time correlation between different channels or sources of data. This synchronization allows for the accurate analysis and interpretation of the acquired data.
- Data Processing and Analysis: Once the data is acquired and stored, it can be processed and analyzed using specialized software and algorithms. Data processing may involve filtering, noise reduction, signal analysis, or any other operations required for the specific application.
- Real-Time Monitoring and Visualization: In some cases, high-speed data acquisition systems may include real-time monitoring and visualization capabilities. This allows engineers and researchers to observe the data as it is being acquired and analyze it in real-time, enabling quick decision-making and troubleshooting.
High-speed data acquisition systems are used in a wide range of applications, such as crash testing, vibration analysis, structural health monitoring, aerospace testing, and high-speed imaging, where capturing data at rapid rates is crucial for obtaining accurate results and insights into fast-changing events.
Crash Barrier Test Data
During crash barrier testing, various types of data are collected to assess the performance and effectiveness of the barrier in mitigating and reducing the impact forces during a crash. The specific data collected can vary depending on the testing standards and objectives, but here are some common types of data typically collected during crash barrier testing:
- Acceleration and Deceleration Data: Sensors placed on the crash test dummy or the vehicle record the acceleration and deceleration forces experienced during the impact. This data helps evaluate the severity of the crash and the effectiveness of the barrier in reducing the forces on occupants.
- Force and Load Data: Load cells and strain gauges are used to measure the forces exerted on the crash barrier during the impact. This data is essential to understand the barrier’s structural integrity and its ability to withstand the collision forces.
- Displacement Data: Displacement sensors track how much the crash barrier moves during the impact. It helps assess the barrier’s ability to absorb energy and prevent the vehicle from penetrating or bypassing the barrier.
- Deformation and Damage Data: Visual inspection and various measurement tools are used to assess the extent of deformation and damage sustained by the barrier and the vehicle. This data is critical for understanding the effectiveness of the barrier in dissipating energy and protecting the occupants.
- Velocity Data: Sensors may be used to measure the pre-crash and post-crash velocities of the vehicle. This information helps calculate the change in speed and the severity of the impact.
- Acceleration Pulse Analysis: Crash test dummies are equipped with sensors to record the response of different body regions during the crash. This data helps evaluate the potential injury risks to occupants.
- Video and High-Speed Imaging: High-speed cameras and video recording are used to capture the entire crash event from different angles. This visual data aids in analyzing the crash dynamics and identifying potential areas of improvement for the barrier design.
- Computer Simulations: In addition to physical testing, computer simulations are often conducted to model the crash behavior and analyze how different barrier designs perform under varying conditions.
- Environmental Data: Weather conditions and other environmental factors at the time of testing are recorded as they can influence the crash dynamics.
Collecting and analyzing this data allows engineers and researchers to evaluate the performance of crash barriers, understand their limitations, and make necessary improvements to enhance road safety. These tests are critical in ensuring that crash barriers provide effective protection to road users in real-world scenarios.
Ozone Layer Testing Data
When testing ozone layer holes, scientists and researchers collect a wide range of data to monitor the state of the ozone layer and understand the processes that contribute to its depletion. The ozone layer is typically assessed using satellite observations, ground-based measurements, and atmospheric modeling. Some of the key data collected during ozone layer monitoring include:
- Total Ozone Mapping Spectrometer (TOMS) Data: TOMS instruments aboard satellites provide information about the total column ozone content in the atmosphere. They measure the concentration of ozone from space and help track changes in the ozone layer’s thickness and distribution.
- Ozone Monitoring Instrument (OMI) Data: Similar to TOMS, the OMI instrument on satellites measures the total column ozone and provides high-resolution ozone data for more accurate monitoring.
- Ozone Vertical Profile Data: Ground-based instruments like lidars and ozonesondes are used to measure the vertical distribution of ozone in the atmosphere. This data helps to understand how ozone concentrations change with altitude.
- Stratospheric Aerosol and Gas Experiment (SAGE) Data: SAGE instruments onboard satellites measure not only ozone but also other important gases and aerosols in the stratosphere, helping to study the complex interactions affecting the ozone layer.
- Ozone Hole Area and Depth Data: Researchers track the extent and depth of the ozone hole over Antarctica using satellite observations and ground-based measurements. This data is crucial for understanding the seasonal variations and trends in ozone depletion.
- Solar Ultraviolet Radiation Data: Measurements of solar UV radiation at the Earth’s surface are collected to study the effects of ozone depletion on the amount of harmful UV radiation reaching the Earth’s surface.
- Atmospheric Composition Data: Data on other trace gases and chemical compounds in the atmosphere, such as chlorofluorocarbons (CFCs) and nitrogen oxides, are gathered to analyze their role in ozone depletion processes.
- Climate and Weather Data: Meteorological data is collected to study how climate patterns and weather conditions may affect the dynamics of the ozone layer.
- Satellite Imagery and Remote Sensing Data: High-resolution satellite imagery and remote sensing data help visualize the ozone layer’s spatial distribution and provide valuable information for research and communication.
- Modeling and Simulation Data: Climate models and atmospheric simulations are used to predict and understand ozone depletion processes and to assess the effectiveness of policies aimed at protecting the ozone layer.
Collecting and analyzing these data sets is vital for ongoing research into the state of the ozone layer, the impacts of human activities, and the effectiveness of international efforts to limit ozone-depleting substances. Monitoring the ozone layer is critical to safeguarding the Earth’s biosphere from harmful ultraviolet radiation.
Nuclear Reactor Wall Penetrability Test Data
Testing the penetrability of nuclear reactor walls typically involves subjecting the reactor to high-speed impact forces, simulating the conditions of a potential collision or crash. The F-4 Phantom Rocket Sled was used as a platform to propel a test projectile or object at high velocities towards the nuclear reactor wall.
The data collected during such tests might include:
- Impact Force Measurements: Sensors and load cells placed on the test projectile and the reactor wall would measure the forces and stresses experienced during the impact. This data helps determine if the reactor wall can withstand the impact forces without breaching.
- Deformation Analysis: High-speed cameras and imaging techniques could be used to analyze the deformation of the reactor wall and the projectile during the impact. This information is crucial in understanding the structural response and integrity of the reactor wall.
- Temperature and Radiation Measurements: Sensors may be used to measure temperature changes and radiation levels on the reactor wall caused by the impact. This data helps assess the potential damage and safety implications.
- Material Analysis: After the test, samples of the reactor wall material may be taken for laboratory analysis to examine the extent of damage and any potential weaknesses or vulnerabilities.
- Simulation and Modeling Data: Computer simulations and modeling are often employed to predict the behavior of the reactor wall under different impact scenarios. This data can provide additional insights and aid in designing better protective measures.
- Safety Data: Throughout the testing process, safety measures would be in place, and data related to safety protocols, emergency responses, and containment procedures would be recorded.